Dashboard Reference
The ArqonHPO Dashboard is a web-based UI for monitoring and interacting with running optimization jobs.
Starting the Dashboard
Options
| Flag | Default | Description |
|---|---|---|
--state | (required) | Path to solver state file |
--events | (optional) | Path to events log file |
--actions | (optional) | Path to actions log file |
--addr | 127.0.0.1:3030 | Address to bind HTTP server |
Then open http://127.0.0.1:3030 in your browser.
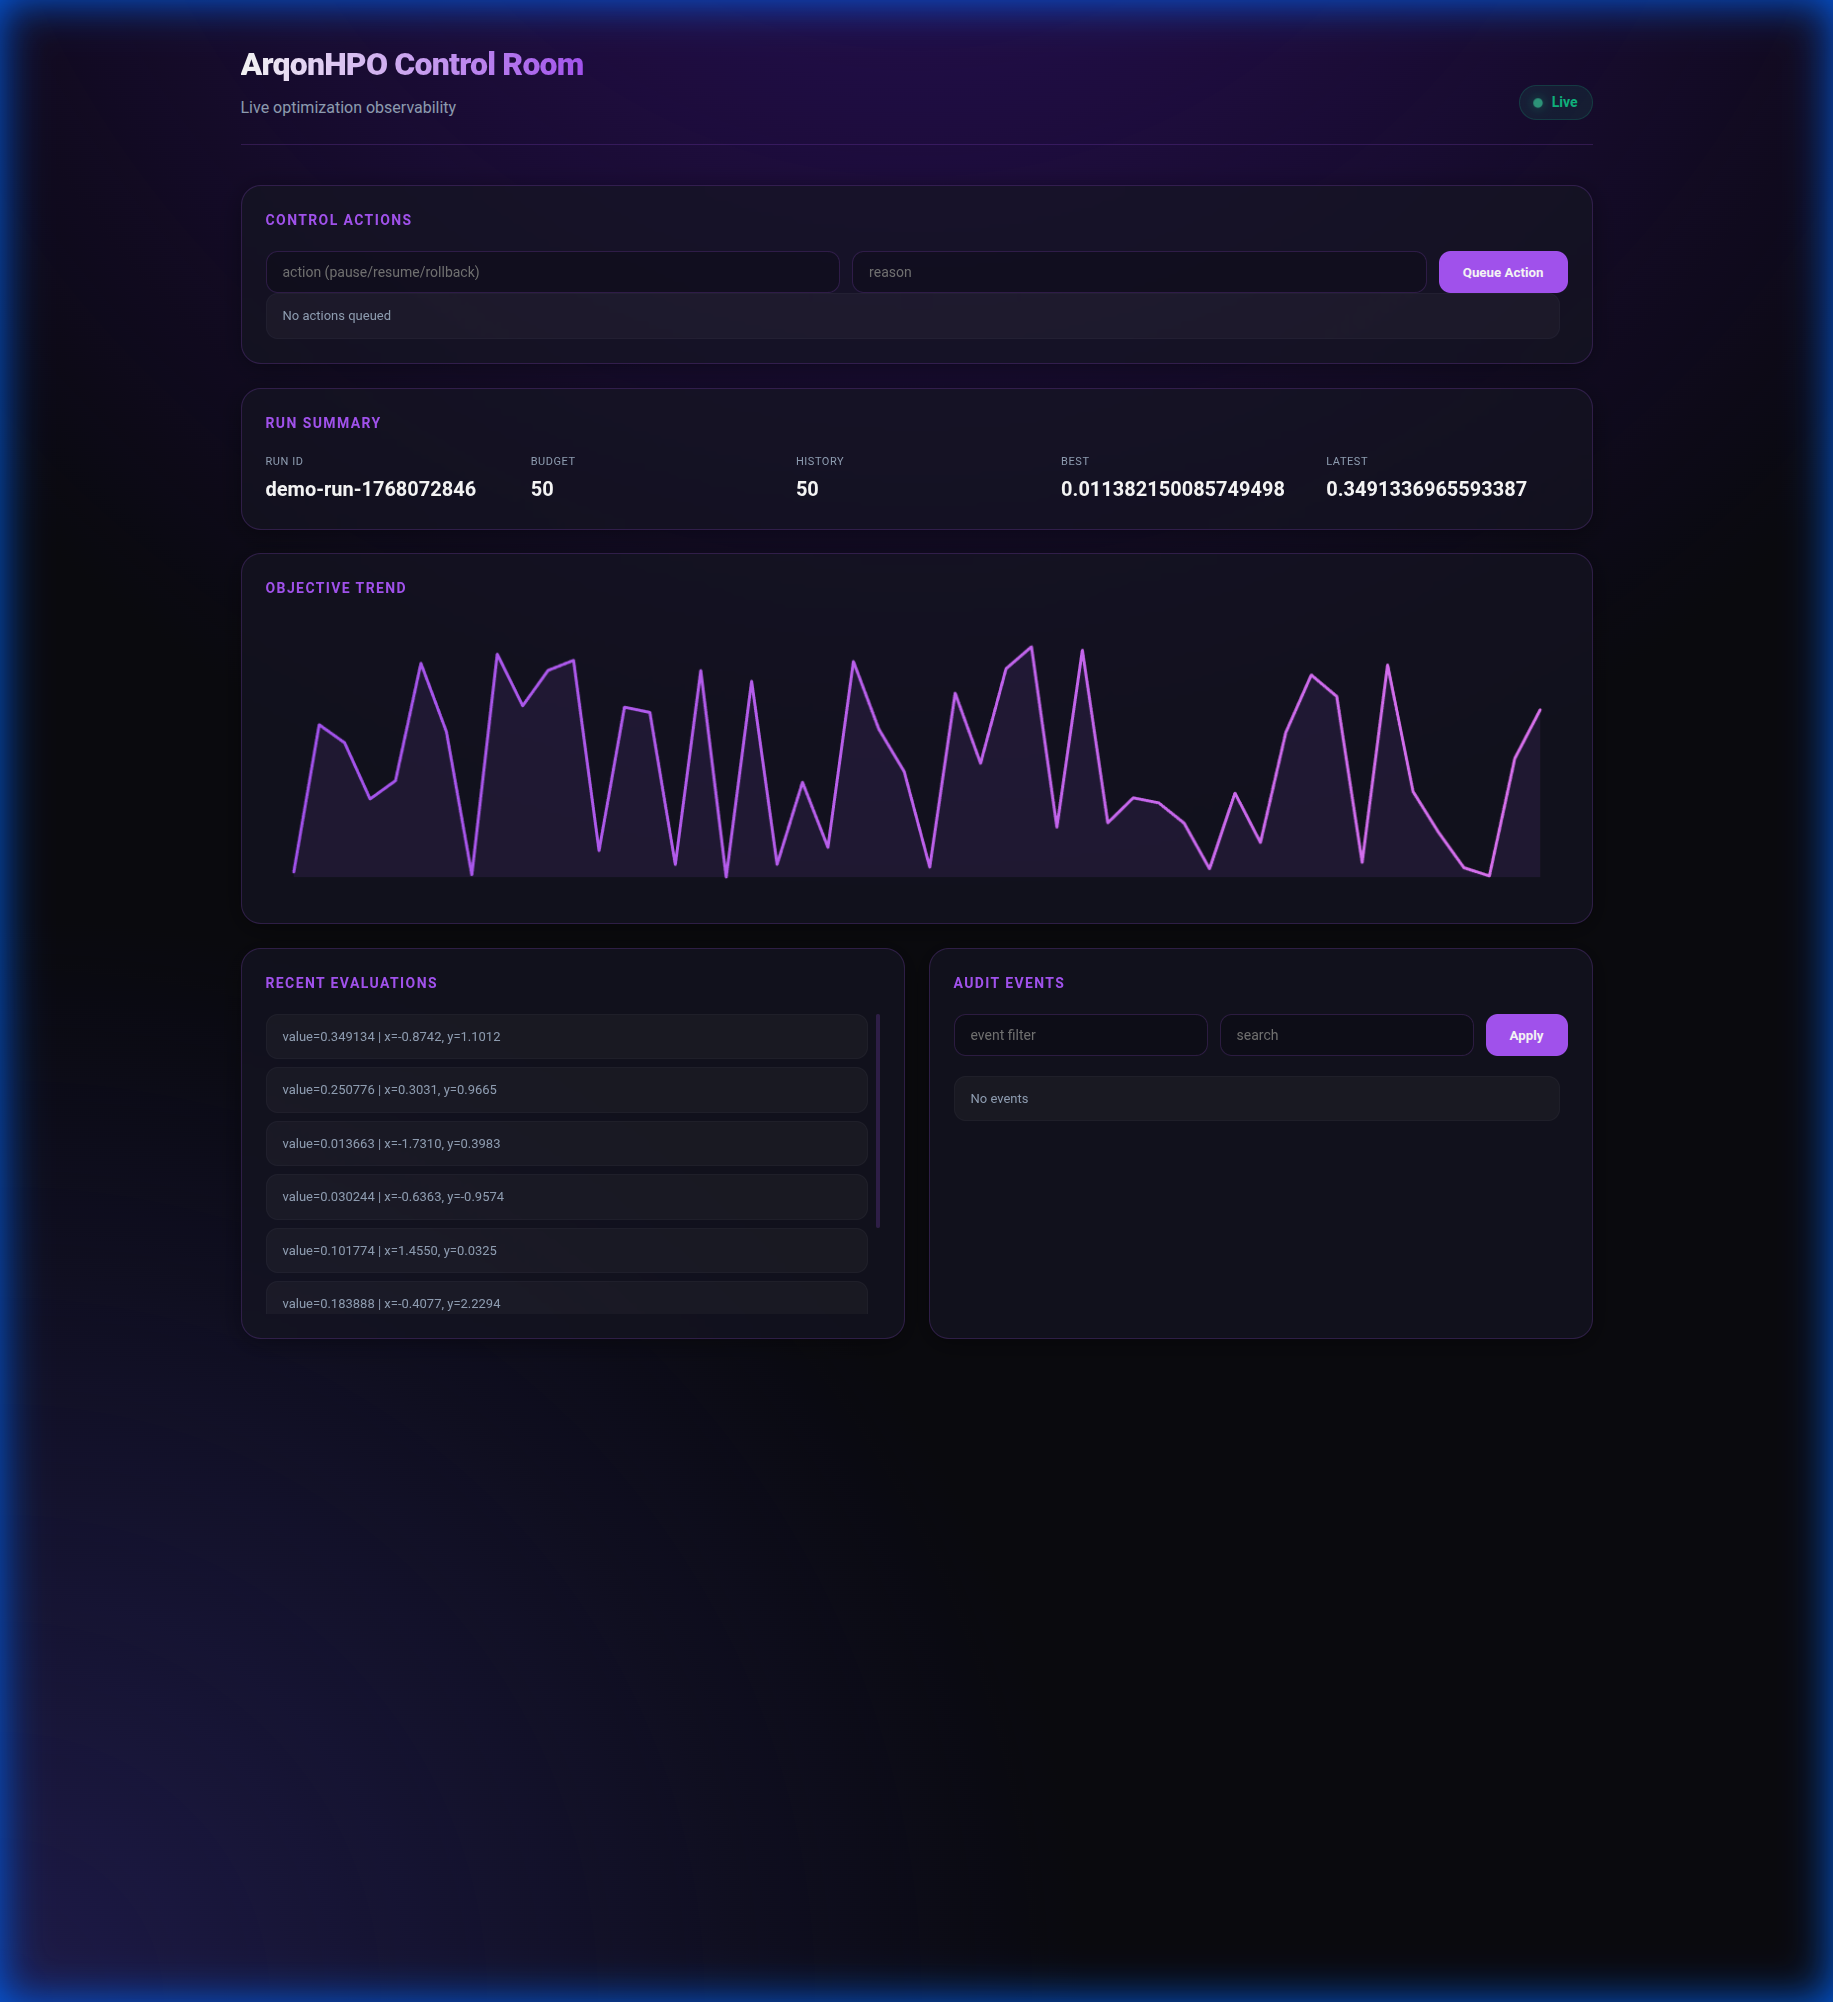
Interface Overview
The dashboard provides:
- Status Panel — Current phase, budget usage, best value
- Parameters Table — Current best parameters
- History Chart — Objective value over iterations
- Event Log — Real-time event stream
- Actions Panel — Send commands to the solver
REST API Endpoints
The dashboard serves a REST API for programmatic access:
GET /api/state
Returns the full solver state.
Response:
{
  "config": {
    "seed": 42,
    "budget": 100,
    "bounds": { ... }
  },
  "history": [
    {"params": {"x": 0.5}, "value": 1.23, "cost": 1.0},
    ...
  ],
  "phase": "Refine",
  "best_idx": 42
}
GET /api/summary
Returns a compact summary of optimization progress.
Response:
{
  "phase": "Refine",
  "budget_used": 45,
  "budget_total": 100,
  "best_value": 0.0234,
  "best_params": { "x": 1.98, "y": -0.99 },
  "history_len": 45
}
GET /api/events
Returns recent events from the events log.
Query Parameters:
| Param | Type | Description |
|---|---|---|
since | int | Unix timestamp, return events after this time |
limit | int | Maximum events to return (default: 100) |
Response:
{
  "events": [
    { "ts": 1704067201, "type": "ask", "batch": 4 },
    { "ts": 1704067202, "type": "tell", "count": 4 }
  ]
}
GET /api/actions
Returns recent actions from the actions log.
Response:
POST /api/actions
Send an action to the solver.
curl -X POST http://127.0.0.1:3030/api/actions \
  -H "Content-Type: application/json" \
  -d '{"type": "pause"}'
Action Types:
| Type | Description |
|---|---|
pause | Pause optimization |
resume | Resume optimization |
stop | Stop optimization (cannot resume) |
rollback | Revert to previous best |
Response:
Security Considerations
[!WARNING] The dashboard does not have authentication. Bind only to
127.0.0.1or use a reverse proxy with auth.
For production use:
Prometheus Metrics
The dashboard also exposes Prometheus metrics if --metrics-addr is set:
Then scrape http://127.0.0.1:9898/metrics.
Next Steps
- TUI Reference — Terminal-based monitoring
- Observability — Prometheus metrics
- CLI Reference — Full CLI documentation